
What is DOE?
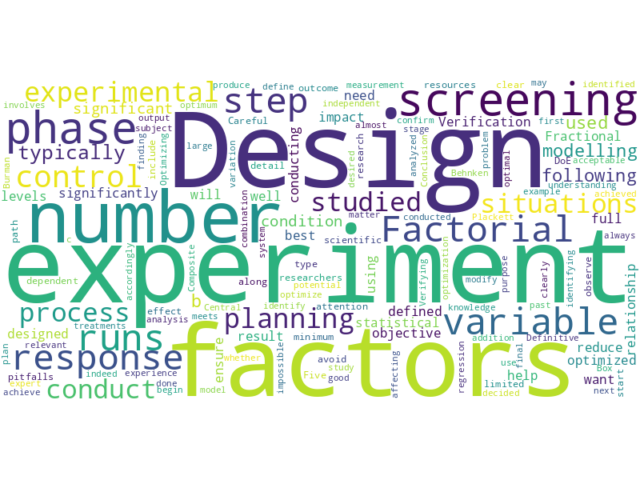
Design of Experiments (DOE) is a systematic, mathematical approach used to understand and optimize the relationship between input factors and output responses [1]. It is a branch of applied statistics that allows researchers to change multiple variables at once in a controlled way to determine which factors are truly significant and how they interact with one another [3].
Core Components of DOE
To build a DOE model, you must define the following four elements:
- Factors: The independent variables you intentionally change (e.g., Temperature, Pressure) [1].
- Levels: The specific settings or values assigned to each factor (e.g., 180°C and 200°C) [3].
- Response: The output or result you are measuring (e.g., Product Yield, Car Speed) [2].
- Noise: Uncontrollable variables that might cause variation in the results (e.g., ambient humidity) [2].
The 5 Phases of DOE
A standard DOE framework follows a specific lifecycle to move from initial curiosity to a fully optimized process [2, 5]:
- Planning: Defining the objective, identifying potential factors, and ensuring the measurement system is accurate [5].
- Screening: If there are many potential factors (usually >5), screening experiments like Plackett-Burman or Fractional Factorial are used to narrow them down to the “vital few” [1].
- Modeling: Once significant factors are known, a mathematical relationship (regression) is built to map how inputs affect the output [3].
- Optimizing: Using methods like Response Surface Methodology (RSM) to find the exact “sweet spot” or peak performance [5].
- Verifying: A final “confirmation run” is performed at the optimized settings to ensure the results match the model’s predictions [1].
Why DOE is Better than Traditional Testing
Traditional testing often uses the One-Factor-at-a-Time (OFAT) method. DOE is statistically superior for several reasons:
| Feature | Traditional (OFAT) | DOE Framework |
| Interactions | Cannot see if two factors depend on each other [3]. | Specifically designed to find and map interactions [1]. |
| Efficiency | Requires many more runs to cover the same ground [3]. | Finds the best answer with the minimum number of tests [2]. |
| Predictive Power | Only tells you about the specific points you tested [3]. | Creates a mathematical “surface” to predict results at any setting [5]. |
[Image comparing one factor at a time vs factorial design]
References
- [1] American Society for Quality (ASQ): Design of Experiments (DOE) Overview.
- [2] JMP Statistics Knowledge Portal: The DOE Workflow and Analysis.
- [3] Czitrom, V. (1999). One-Factor-at-a-Time Versus Designed Experiments. The American Statistician.
- [4] NIST/SEMATECH e-Handbook of Statistical Methods: Process Improvement via DOE.
- [5] Montgomery, D. C. (2019). Design and Analysis of Experiments, 10th Edition. Wiley.
Our Score
Click to rate this post!
[Total: 0 Average: 0]
Visited 4 times, 1 visit(s) today